Time series Night-time Light animation with GEE
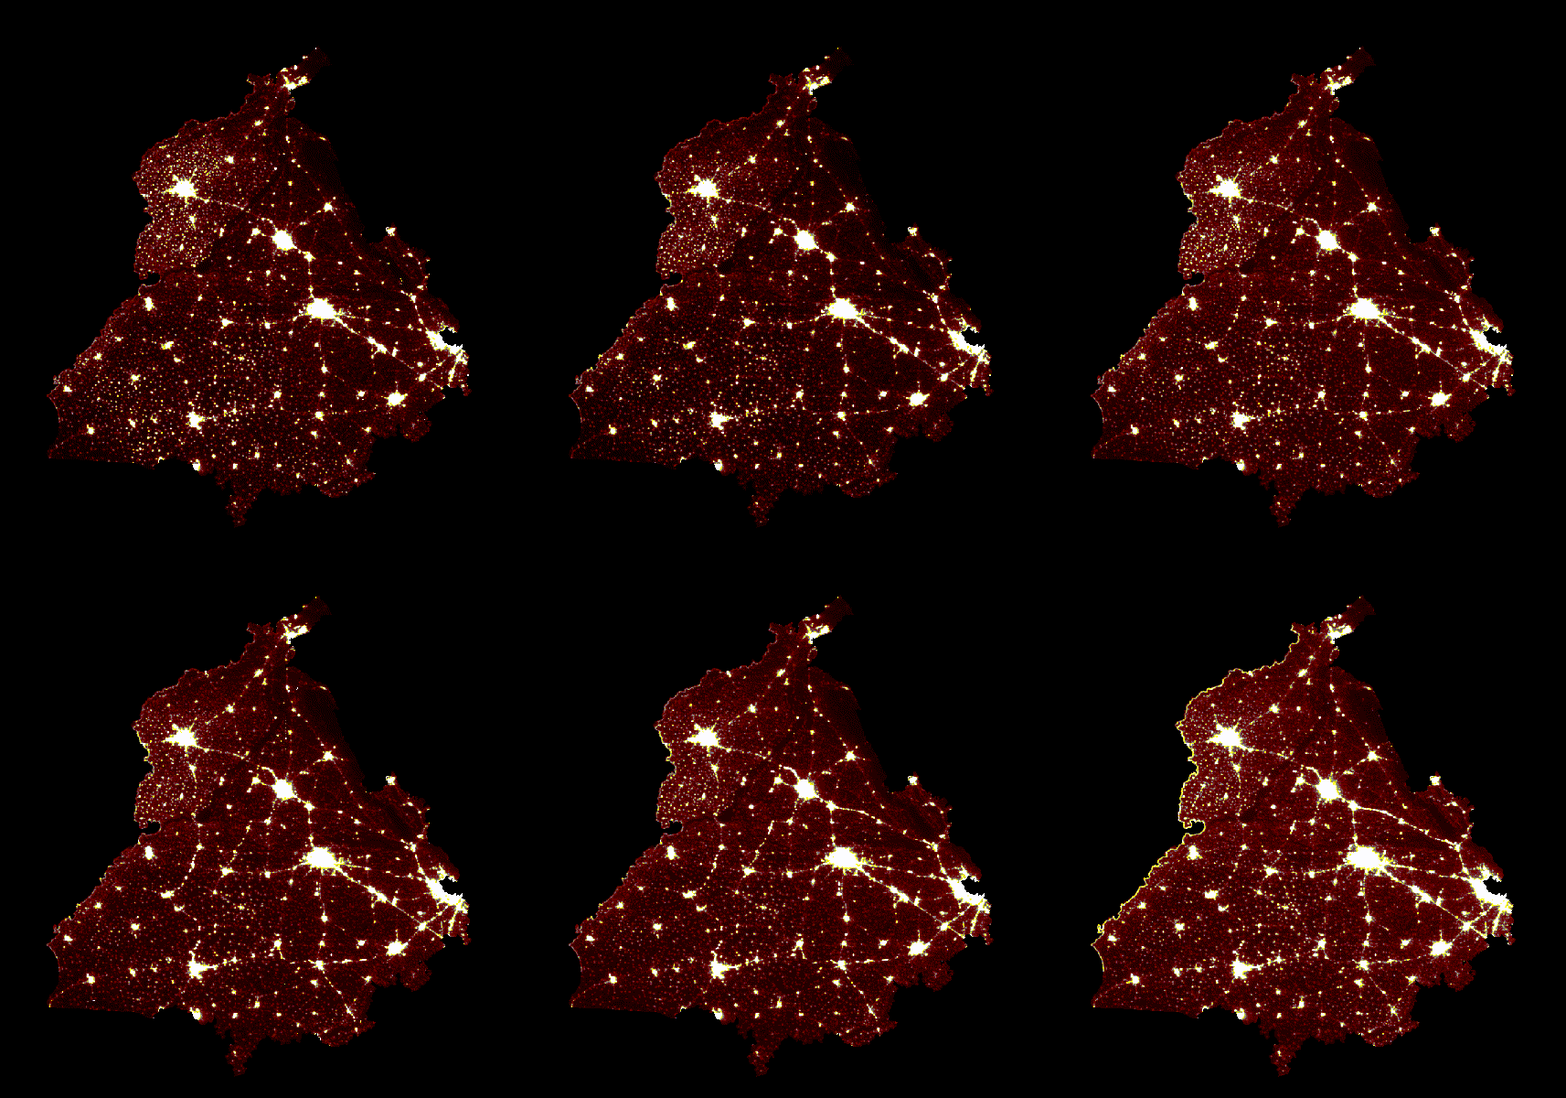
Unlike most satellite imagery and data, views of Earth at night tell a distinctly human story. Lights show where people have made their homes, set up their industries, and laid down their roads. The animation depicts differences in night-time lighting between 2014 and 2022. The data come from the Visible Infrared Imaging Radiometer Suite (VIIRS) and animation generated with GEE. In the gif, the changes are most dramatic near the Indo-Pak border where night light increases significantly, suggesting that security forces are more active in border areas. Another significant change in the highway’s night light connecting major cities (Jalandhar, Ludhiana, and Mohali/Chandigarh) indicates an increase in vehicle movement on these roads, as well as an increase in the extent of night light in these major cities, which appears to be the expansion and more night activities in these cities.

