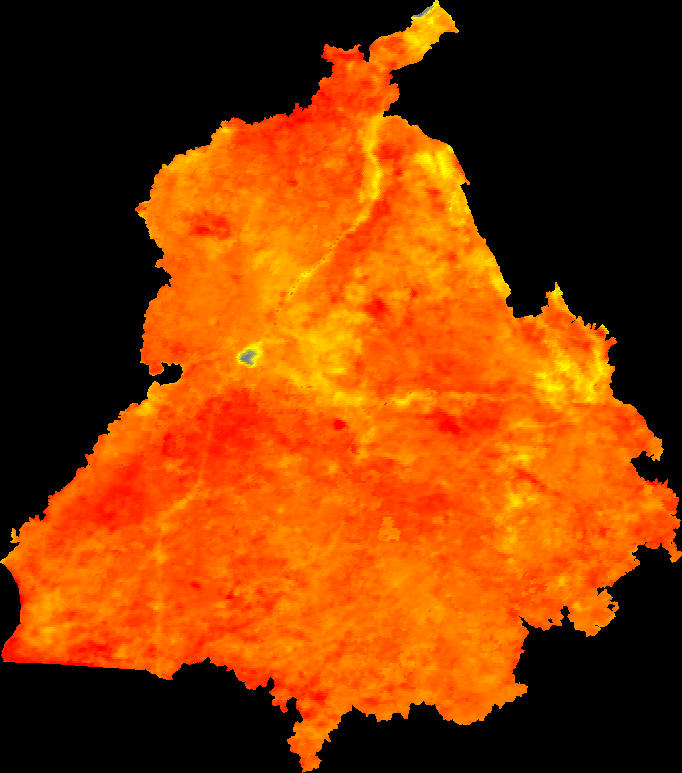
Land surface temperature extraction from MODIS product with GEE
In this project, we are going to extract the average monthly temperature of Punjab for each district from 2000 to 2022 using GEE from MOD11A2.061 Terra Land Surface Temperature (LST) product and we will employ this data in another data analysis project to evaluate the effect of temperature on Rabi season crop yield.
MODIS Terra Land Surface Product
MOD11A2.061 Terra Land Surface Temperature is a product of the Moderate Resolution Imaging Spectroradiometer (MODIS) instrument aboard the Terra satellite. It provides information about the temperature of the land surface, which is important for a variety of applications such as weather forecasting, agricultural monitoring, and wildfire detection. Researchers, government agencies, and the private sector for a variety of applications widely use the MODIS LST product. It is freely available to the public through the National Aeronautics and Space Administration (NASA) Earth Observing System Data and Information System (EOSDIS).
This product is derived from thermal infrared measurements acquired by the MODIS instrument. It provides 8-day average, global coverage of land surface temperature at a spatial resolution of approximately 1 km. The data is available in daytime and night-time versions, with separate bands for each

Code Explanation
- Punjab shapefile with district boundaries is imported from assets and defined as a region of interest (roi) in the code.
- A function is defined to scale and convert the values from Kelvin to degree Celsius.
- The imported shapefile is converted to feature collection to reduce temperature data as the monthly average for each district.
- A function is defined to get days since the epoch for the first day of the year from properties.
- Modis data is added in the script as imagecollection with filter bounds as roi and mapped to degree celsius with the function defined in step 2.
- After defining desired dates LST data is further filtered to these required dates and “LST_Day_1km” band is selected.
- A nested function is defined and mapped simultaneously to select a particular year and return the mean temperature for each month.
- Afterward, the extracted mean temperature from a nested function is returned as “meanLST” for each month for all districts in the feature collection with the “reduceRegions” function.
- This data with three columns ‘date’, ‘meanLST’, and ‘dtname’ (district name) are exported to google drive as a CSV file.
